Sunday 24 June 2018

ALG 20

Algebraderci! This post might be the last ALG post (at least for a while). Fittingly, perhaps, we devote this week's task to rules of single and double false position, which are methods that go back about 2000 years and that surfaced in many parts of the world - China, Egypt, the Arab world, India and, eventually, Europe. It is not clear whether the methods spread from one region to another, or were discovered/invented spontaneously in several regions. They were generally used to solve practical problems and as such were known not just to mathematicians but to people such as merchants who would use them as algorithms, ie as rules that worked rather than as rules that needed to be justified and proved. The rules apply to situations that we would now represent with linear or affine equations, ie equations of the form y = ax and y = ax + b respectively. However the rules were devised many centuries before symbolic algebra was invented, and continued to be used for some centuries thereafter.
-
MONDAY: We start with a problem taken from the Eygyptan Rhind Mathematical Papyrus (RMP), which dates from about 1550 BC and was written by a 'copyist', Ahmose, who claims to have been copying work from one or several centuries earlier.
This particular problem is quite straightforward, and certainly doesn't need formal algebra, though that provides one way of solving it. We present it here to illustrate the rule of single false position, which is the way it is solved in the RMP.
The above problem is Problem 26 in the RMP. Problems 24, 25 and 27 are similar, though interestingly they would seem more complex to us than Problem 26, since their solutions are all fractional. In fact, the first three problems appear to get progressively easier! Something to think about, for the small-stepping devotees of 'intelligent practice'.
Here are the problems, expressed in modern form:
24: x + x/7 = 18
25: x + x/2 = 16
26: x + x/4 = 15
27: x + x/5 = 21.
-
TUESDAY: We show how a problem can be solved using the rule of double false position - or rather, we show the first two steps, and leave it to the reader to complete the method. We provide some help with the final step in Wednesday's version of the task.
Note: We came across this Apples task in a very useful conference paper by Schwartz, presented in 2004. Schwartz gives the source of the task as the Liber Augmenti et Diminutionis: "This book, probably from the 12th Century, is the translation of some now-lost earlier work attributed to one 'Abraham' and generally believed to have been written in Arabic or Hebrew" (ibid). The task can also be solved algebraically, though it wouldn't have been in its day. Interestingly, an algebraic approach turns out to be very cumbersome here, compared to the use of double false position.
-
WEDNESDAY: We revisit Tuesday's task but use a diagram to help make sense of the double false position rule.
In this example, the double false position rule can be written as (100×21 – 204×8)÷(21 – 8), which reduces to 36. An alternative version, which can perhaps be derived more directly from the diagram, is this:
100 – 8/(21–8) of (204–100)
= 100 – 8/13 of 104
= 100 – 64
= 36.
 The general form of the rule is (xe₂ – xe₁)÷(e₂ – e₁) which, presented rhetorically, would in ancient times probably have been treated simply as a practical algorithm to be learnt and applied.
-
THURSDAY: We apply the double false position rule to parts of a fish.... This problem was probably written by de la Grange. It appears in the 1822 translation into English of Euler's Elements of Algebra. The intention would have been to solve the task algebraically, using simultaneous equations. However, it also lends itself very nicely to the double false position approach.
Here, the weighted average of 11 and 31 can be written as (2×11 + 8×31)÷(8 + 2) = (22+248)÷10 = 27, so the head weights 27 lb. [In turn, the fish weighs 72 lb, as stated in the text.]
Here's a nice bar-model approach (thanks to Bernie Westacott). One can see how it corresponds to an algebraic approach using simultaneous equations.

-
FRIDAY: Friday night is bath night and we take a (classic) bath.... This type of problem goes back centuries, though this one is only from 1936 (it is quoted in a paper co-authored by Arcavi). The problem is remarkably easy to solve using single false position. A greater challenge is to find an informal method - to start with, it might be helpful to simplify the task slightly, by ignoring the waste-pipe, ie by putting the plug in the bath.
Valediction: 20 sets of task, that's 20 weeks or almost 5 months of algebra tasks, 100 in all. Time to say Algebraderci (at least for a while).

Sunday 17 June 2018

ALG 19

This week we're looking at graphs that model 'real life' situations. The focus is on qualitative aspects of the graphs, though we do take a more analytic view at times. Pioneering work on school students' understanding of graphs was undertaken in the late 1970s and early 1980s by Daphne Kerslake, by Claude Janvier and by Malcolm Swan. I doubt whether one can better some of their outstanding tasks.
-
MONDAY: Mathematically, this task involves a nice context, though one that is perhaps not so familiar to today's school students - you might therefore have to tease out the crucial fact that audio tape has to travel at a constant speed (as it passes over the tape-head which picks up the sound). Most students will realise that as the left hand spool unwinds, the width (diameter) of the reel of tape decreases. This means the circumference also decreases and so each successive turn of the spool will feed out less and less tape. So if the tape passes the tape-head at a constant speed, the spool will rotate more and more quickly, and the width of the reel will decrease more and more rapidly.
This task should generate rich classroom discussion about these geometric aspects of the context and about the shape of the graph: the graph clearly slopes downwards, but is it a straight line?
As the width of the reel of tape decreases more and more rapidly (over time), the slope of the graph gets progressively steeper (the gradient is negative throughout). This raises interesting questions about the slope near points A and B. Could it be horizontal at A and vertical at B? [Well, no, not quite...] And if we continue the curve, where might it cut the x-axis, and what would this mean in terms of the context?
Note: The curve through A and B is a parabola. It turns out that it passes roughly through the point (76, 0) and that the relationship between M minutes and W mm, is given by M ≂ 76 – (W²/30) [or, more precisely, W = 78.83 – (12W²/345)*, if we assume the given measurements are accurate].
*You might like to verify this formula (please correct me if I've got it wrong).
-
Note 2: Here is an alternative wording for the task. Would this be better?
-
TUESDAY: In this task we assume that the pile of sand keeps its exact shape as it gets bigger. Students might initially think that if the time for which the sand flows is doubled (from 1 minute to 2 minutes), then the height of the pile will be doubled too. (It turns out that it takes 8 minutes rather than just 2, for the height to reach 2 metres - something we look at in Wednesday's task.)
However, it shouldn't take much discussion for students to realise that as the pile gets higher it gets wider too, so ever more sand is needed to raise the height by a given amount. This means that the graph will consist of a curve with an ever flatter positive slope. In turn this means that at the 2 minute mark, the height of the graph will be substantially less than 2 (m). However, at this juncture we wouldn't expect students to have a more precise sense of what that height will be. This is something we consider in a more analytic way in Wednesday's task.
-
WEDNESDAY: We consider what the height of the pile of sand will be after 2 minutes, and use this information to draw a more accurate graph, which we then use to interpolate the height at 2 minutes.
If we double the height of the pile of sand, from 1 m to 2 m, we also double the width (in two dimensions), so we have 2×2×2 = 8 times as much sand as before, so it will take 8 times as long to produce.
A good approximation for the value of the height at 2 minutes is 5/4. This is close to the cube-root of 2, since (5/4)-cubed is 125/64 = 1.953125.
-
THURSDAY: We step onto a travelator and think about some (nice, simple, straight line) distance-time graphs.
-
FRIDAY: We relate our distance-time graphs to speed-time graphs. This may not be easy - they look so very different!
Before thinking about the speed-time graph for Mario, it is interesting to consider how students might arrive at the red line - ie the distance-time graph for Mario while he is walking on the travelator. One way would be to find a specific point [such as (10, 14)] and join it to (2, 2) with a straight line. Another way would be to consider the distance travelled each second on the travelator - namely 0.5 m due to the travelator, plus 1 m due to the fact that Mario is walking at 1 m per second relative to the surface of the travelator - so the red line has a slope of 1.5 (m per sec).
Marco's and Mario's speeds are constant for most of the time (except for the brief moments when their speeds change). This means their speed-time graphs will consist primarily of horizontal straight lines. As such, the graphs look very different from the distance-time graphs, where the increase in distance (from Lisa) over time is shown by the upward slope of the graphs. In contrast to this, on the speed-time graphs, the increasing distance is shown by the increase in area under the graphs as the time increases. This looks far less dramatic.

Monday 11 June 2018

ALG 18

This week we look at the rules of arithmetic, as expressed through the use of brackets. But we start informally, with a 'real life' task, specifically a sour dough problem, which may not be to everyone's liking....
-
MONDAY: A lighthearted story about pizza slices.
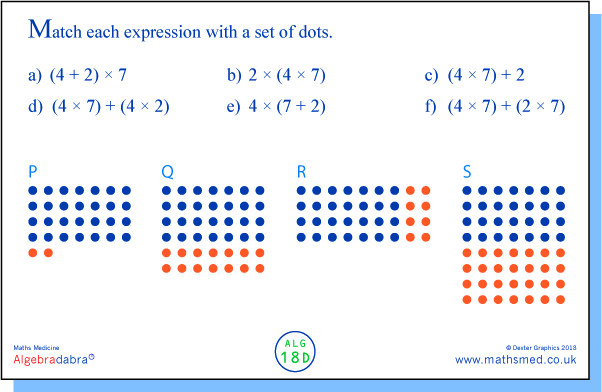
TUESDAY: Here we complete some numerical expressions involving brackets to describe a set of dots.
No pizzas.... No pseudo contexts...? Just dots. Simple.
Note: I have curtailed the string of expressions a bit. You might, for example, want to insert the expression 3×5×(20+?), and perhaps also 3×(5×20 + 5×?), between my second and third expressions.
-
WEDNESDAY: Here we look at expressions that give the total number of dots in a (recursive) dice pattern.
Note 1: we have used brackets more frequently than is strictly necessary here, so that the order of operations is explicit and unambiguous, ie so that the expressions can be read without knowing the conventional order of operations. Of course, it is important to learn these conventions but it means that the current expressions should be accessible to a high proportion of students. Also, as the expressions refer to familiar, concrete elements that are easy to group and count, the work should help demystify the use of expressions involving brackets - students don't need to refer to rules like 'do the brackets first' to make sense of the notation.
Note 2: you might want to ask students to annotate the diagram, or to draw a revised diagram, to show how the dots are being structured by the various expressions.
-
THURSDAY: Here we use expressions to count dots in some partitioned/compound arrays.
Again, it might be helpful to annotate the sets of dots to show how they relate to the expressions.
-
FRIDAY: We look at some neat and some not so neat ways of performing the calculation 15 × 22.

This slide is somewhat overloaded. It's really two tasks in one. And for the first task, it would be better to introduce the parts one at a time. Then, having worked through these exemplars, it should prove fruitful to devote time to students' methods of calculating 15 × 22, and to representing these as strings of expressions involving brackets.
The second task should help students take a more conscious, formal view of the distributive law and to think about when it applies.

Sunday 3 June 2018

ALG 17

She was just seventeen, You know what I mean, And the way she looked Was way beyond compare. How could I dance with another? Oooh! When I saw her standing there.
One of the great early Beatles tracks. With ALG 17, we're standing on the number line and seeing how our position is related to multiples, especially multiples of 2 and 3.
-
MONDAY: Where do multiples of 3 occur on the number line? How can we tell whether a multiple of 3 is also a multiple of 6? And of 9??
TUESDAY: This is a classic task that I was introduced to by Lulu Healy. You might want to generate some data and look for patterns, but it is also perfectly accessible via a generic (analytic) approach by thinking about the occurance of multiples in strings of consecutive numbers.
 WEDNESDAY: more multiple fun....
This task keeps catching me out! One moment I think it's OK, the next I think I've got it wrong and it doesn't work!
Part b) can be solved by simply going through the multiples of 7 and 8 in the standard times tables, which leads us to 63, 64. However, a key feature here is the relation of these numbers to 56 (= 7×8) .... Or one can make use of 'the difference of two squares': 8×8 is a multiple of 8, 8×8 – 1  = (8–1)(8+1) is a multiple of 7. [This generalises very nicely, eg to finding consecutive numbers that are multiples of 19 and 20 respectively.]
-
THURSDAY: A classic 'think of a number ....' task. The task has links with Tuesday's version of ALG 17 and one can get quite a long way by using an empirical, data-generating approach. However, its attraction lies in the fact that one can use some fairly routine algebra to throw light on the underlying structure. [This is all the more noteworthy, given that we often use algebra to ease our path to an answer while ignoring structure!]
Note: I came across this particular task in a 1995 paper by Alan Bell (Purpose in school algebra, JMB, 14, 41-73). Sadly, Alan died this year. (9 April 1929 - 5 April 2018)
-
FRIDAY: We take an explicit look at the structure of Thursday's task.
Here the geometric and/or symbolic representation may help us see that Thursday's task results in the product of the 'outer two' of three consecutive numbers. When the middle number is odd, the outer numbers will be even so both must be a multiple of 2 and one must also be a multiple of 4 (of course, they can be multiples of other numbers too). So their product is a multiple of 8.

Monday 28 May 2018

ALG 16

This week we look at the structure of arithmagons. This involves algebraic thinking which is made more accessible by the use of algebraic symbolisation, and it is hoped that this might encourage students to use it, though in the absence of such symbolisation it involves algebraic thinking nonetheless.
-
MONDAY: A bank holiday and the beginning of school half term in the UK, but that's no reason to deprive ourselves of algebra. Here's our gentle introduction to arithmagons.
Yes, the intro is rather subtle, but we don't want to over-excite our muddled friend Capt Scarlet...

We can solve the question 'is there enough flour' by looking at the structure of the problem, which  means thinking algebraically. We can take a narrative approach, in this kind of way:
If we add the result of the two weighings, 130 + 160, this is counting the weight of bag A twice, so the total amount of flour is 290 g minus the weight of bag A. So the smaller bag A happens to be, the more flour we've got, and if A weighs 40 g or less, we will have at least 250 g.
Or we can express this with symbolic algebra, in this kind of way:
a + b + a + c = 130 + 160 = 290,
so the total number of grams, a + b + c = 290 – a,
so if a ≤ 40, a + b + c ≥ 250.
-
TUESDAY: The arithmagon quietly makes an appearance, but we stick with the Peter pancakes story for now. [But it's not pancakes for ever.]
We now know the combined weight for each pair of bags and we look at an approach for hence finding the total weight of the bags - and the weight of any one bag.
NOTE: @ilarrosac (Ignacio Larrosa) has made the interesting observation on Twitter that another context for this problem is to find the radii of three touching circles, given the sum of pairs of radii. A nice thing about this is we can transform the arithmagon triangle into a triangle whose sides are proportional to these sums, in this kind of way (below). This also throws light on the situation where the value of a, b or c turns out to be negative.... as we shall see.
-
WEDNESDAY: We can relax. The arithmogadon is here.
We are given the same information as in Tuesday's task, namely the value of the sum of each pairing of the three unknown numbers a, b and c. On Tuesday, we found the value of a + b + c (which then allowed us to find the value of each individual unknown) by adding the three pair-sums and halving:
a+b + b+c + c+a = 2(a + b + c), so a + b + c = (130+160+150)÷2 = 220.
This time we use the fact that c must be 30 more than b, and that the sum of b and c is 150, to find c and hence to find a + b + c.
If we are working formally, we can express this information as c = b + 30 and b + c = 150, which we can then combine and transform in this kind of way: c – 30 + c = 150, so 2c = 180, so c = 90.
It is quite possible that these different approaches would have emerged informally as students investigated the original task, so we have now had a chance to make them more explicit. 
-
THURSDAY: Here we look at that first scenario again, but in a more systematic way and without the 'real life' context.
We bring out the fact which may well have been noticed in ALG 16A, that the smaller the value of a, the greater the value of the sum a + b + c. [Formally, this can be said to stem from the fact that a+b + a+c = 130+160 = 290 = (a+b+c) + a. And as a increases by 1, the value of a + b + c decreases by 1.]
We also look at the limiting values of a for which the three 'vertices' (a, b and c) are all positive:
when a = 0, b = 130 ans c = 160 and the sum S = a + b + c = 0 + 130+160 = 290;
when a = 130, b = 0 and c = 30, and S = 130 + 0 + 30 = 160;
note: when a > 130, then b is negative and c is too when a passes 160.
What we haven't done here explicitly is look at the 'permissible' values of the three sums a+b, b+c and c+a, ie the value for which a, b and c are all positive. However, from the previous paragraph we can show that b+c will range from 30 to 290, with, of course, a+b=130 and a+c=160. In effect, the sum of the two smaller sums must be less than or equal to the larger sum - the same condition that applies to the lengths of the sides of a triangle.
-
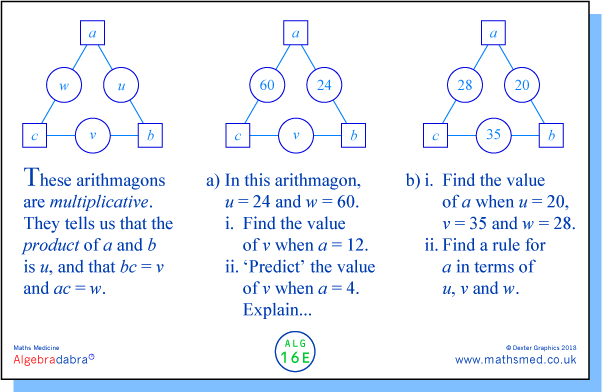
FRIDAY: We switch from an additive to a multiplicative arithmagon. Does Armageddon loom?
Part a) can help us to get a feel for the relationships between the various elements. However, it is quite challenging to pin them down. In b), it is possible to solve part i. by spotting the common factors of u, v, w taken in pairs, though part ii. is likely to prompt one to use formal algebra.
We can solve b)ii using an approach analogous to Tuesday's or Wednesday's approach.
Tuesday's approach: uvw = abbcca = (abc)², so  a² = uvw÷v² = uw/v.
Wednesday's approach: u/v = ab/bc = a/c; wu/v = aca/c = a².

Monday 21 May 2018

ALG 15

We continue with Cartesian graphs for another week - sorry, bad planning! (But worth it, hopefully.)
In this week's tasks we foster a feel for graphs by 'adding' or 'subtracting' them. We begin with a visual approach, by focussing on the 'vertical' distance between two graphs - especially when this is zero, ie where the graphs intersect.
We go on to relate the visual to the symbolic by expressing the graphs symbolically and adding or subtracting the relations.
MONDAY: Here we have two linear functions, f(x) and g(x), though we don't know precisely what they are since the Cartesian axes have not been numbered. However, we can, for example, say that the graph of the new function y = f(x) – g(x) cuts the y axis at the same point as f(x) cuts the axis [Why?], and cuts the x axis directly below the point of intersection of the given graphs [Why?].
It is interesting to note that f(x) is not as steep as g(x). What does this tell us about the slope of y = f(x) – g(x)?
-
TUESDAY: Here we are given some feedback on Monday's task and have the opportunity to consolidate our earlier ideas.
We are are also given one of the functions in symbolic form which allows us to determine the scale of the axes and hence to represent all the other functions symbolically. We can thus link the symbolic with our earlier visual/numerical/analytic approach.
We can use the symbolic representations in various ways. For example, knowing that f(x) = x + 10 and that g(x) = 2x, we can state that y = f(x) – g(x) = x + 10 – 2x which simplifies to y = 10 – x. We can then use this symbolisation to check whether our original sketch (ie the purple line) is correct, or, we could derive the symbolisation from the sketch, given that we now can see that the purple line goes through points with coordinates (0, 10), (10, 0) and (20, -10)
In the case of the function y = f(x) + g(x), we can determine that its line will have a gradient of 3, on the basis that we are adding lines with gradients of 1 and 2, or on the basis that its equation will contain the terms x and 2x, whose sum is 3x.
-
WEDNESDAY: Here we start with a very familiar straight line graph (of the function y = x) and 'perturb' it by adding a second, 'wilder' function. Interestingly, though, the effect of this second function is quite localised....
Note: I came across this lovely idea in Abraham Arcavi's 1994 Symbol Sense paper in For the Learning of Mathematics, 14, 3.
-
THURSDAY: Here we can check whether our sketch for Wednesday's task was on the right lines by comparing it to the red curve: this expresses the fact that the term 1/(x – 4) has a very large effect on the value of y when x is very close to 4, but its effect rapidly diminishes as we move away from x = 4. We then get a chance to build on this by sketching the graph of a closely related function.
The green curve below shows the graph for the new function. Since 2x – 8 = 2(x – 4), the term 1/(2x – 8) has only half the effect of the term 1/(x – 4).
FRIDAY: Here we subtract a linear function from a quadratic function.
The effect turns out to be surprisingly simple: just a translation of the curve (see below). Can we use algebra to find the translation (and to show the shape hasn't changed)?

Interestingly, if one subtracts a similar linear function from a cubic, as below (blue – orange), the resulting cubic curve (grey) is not congruent, or even similar, to the original cubic curve.

Next week: The Arithmagons are coming: Captain Scarlet's bitter foes (or was that the Mysterons?).


Sunday 13 May 2018

ALG 14

This week's set of tasks was inspired by a task (below) from Doug French, that featured in his series The creative use of odd moments that appeared in Mathematics in School. (The jottings occurred during an interview with four high attaining Year 8 students, where we extended the task to find the equations of lines that formed other squares.)
 In our set of tasks we focus on the equations of the lines on which the sides of a square lie, and we look at what happens to the equations when the square changes in simple ways - in particular, its position, size or orientation.
It is of course possible to find each line's equation by using the formal procedure of finding the values of m and c in y = mx + c. However, the way the tasks have been designed should encourage students to think about the relationship between the coordinates x and y of points on a given line. In turn, the focus on the coordinates, especially of points on the axes, should enhance students' understanding of the formal procedure and of the common forms in which equations are expressed (ie y = mx + c, but also x + y = a, when it applies, and perhaps more generally ax + by = c).
MONDAY: We start with a nice little diamond that is fairly near, but not too near, the axes...
The lines have gradient 1 or -1, so we can find the equations by seeing where the various lines cut the y-axis (giving us the value of c in y = mx + c). However, we can also (or instead) work more 'locally', by looking for the relationship connecting the x and y coordinates - eg for points A (8, 8) and D (8–2, 8+2), we can see that x + y = 16. We might also notice that the line through D and C is 4 units 'above' the line through A and B (whose equation is y = x), ie the y coordinate has been increased by +4, for a given x coordinate, so y = x + 4 instead of y = x.
-
TUESDAY: We see what happens to the equations when we translate the square one unit up or across.
Here we provide both a check on Monday's task, and a chance to consolidate the ideas that arose, by varying the task in ways that lead to equations that are closely related to the previous ones.
For each line, we can again look for the (modified) relations between x and y, and/or visualise how the lines have moved and consider, in particular, where they cut the axes.
Notes: Regarding the first approach, we can do this in an empirical way, by examining actual pairs of coordinates, or we can adopt a more general argument. For example, consider what happens to the equation of the line through AD, ie x + y = 16, when the square is moved one unit up. We can examine new coordinate pairs like (8, 9) and (6, 11), which suggests their sum has increased from 16 to 17; or we can argue more generally that for any given value of x, the value of y has increased by 1, so the sum x + y has increased by 1, from 16 to 17.
Visualising the lines can be very helpful, but sometimes care needs to be taken in drawing conclusions from the way a line has changed. For example, when the line with equation x + y = 16 is moved up one unit, it intersects each axis one unit further up or across, which can easily lead to the conclusion that the equation changes from x + y = 16 to x + y = 18, rather than to x + y = 17.
-
WEDNESDAY: Here we change the size of our little diamond. This doesn't change the task substantially, except that we express the new square's coordinates and the resulting equations in a (more) general form. [Note that when it comes to the equations, our new unknown, e, is a parameter rather than a variable.] We can of course check our new equations by letting e take the value 2.
The last part of the task throws up an interesting, if rather arcane, issue. Is the square resulting from the value e = -4 on and above the line y = x, or on and below? If we derive the new square from the equations that arose in the first part of the task, then the answer turns out to be 'below'. Should we be bound by this, ie by the dictates of algebra?! Is this position for the square somehow more 'consistent' than placing it on and above the line y = x ?
-
THURSDAY: We consider a small square with a different orientation from the 'diamonds' we've considered so far - so no longer a little gem?
We're no longer dealing merely with slopes of 1 or -1. So a bit more of a challenge, whether we focus on pairs of coordinates and the relationship between them, or whether we consider where the lines cut the axes.
-
FRIDAY: We translate the square to a position far from the origin, so we are close to asking for general rules for our equations (which of course are already general rules...).
x

Tuesday 8 May 2018

ALG 13

This week we look at the relationship between pairs of values given in a table, and consider how the relationship changes as a result of systematic changes to the values. The new relationship can be found in a variety of ways: formally, by seeing the change in value as a transformation of one or both variables in the algebraic relation; informally, by giving meaning to the relationship and to how a set of numbers has been changed; empirically by searching for a new rule to fit the new set of values.
-
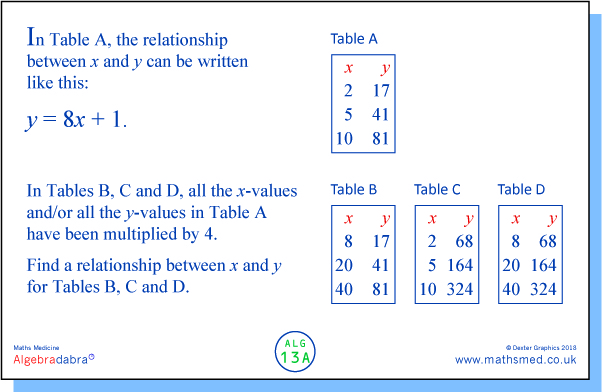
MONDAY: We start with a standard linear relationship and multiply the x- and/or the y-values by 4.
Some students might be able to approach this formally. For example, in the case of Table B, we can think of the 'new' x (denote it by x', say) as replacing 4 times the old x, ie x' = 4x, and so y = 8x + 1 = 2×4x + 1 becomes y = 2x' + 1.
Or, less formally, "the new x-values are 4 times the old x-values, so multiplying the old x-values by 8 is the same as multiplying the new x values by 2; so y = 8x + 1 becomes y = 2x + 1".
Or students might notice, by examining the numbers in Table B, that 17 = 2×8 + 1, 41 = 2×20 + 1, etc.
IMPORTANT NOTE: For brevity we have presented the three tables, B, C and D, on one slide. In class, it might be better to present the tables one at a time so that students can devote plenty of time to each rather than feeling they have to rush from one table to the next.  
-
TUESDAY: Here, we start with the same relationship as in ALG 13A, but instead of multiplying by 4, we add 4 to the x- and/or the y-values.
Again, students might adopt a formal, a semi-formal, or an empirical approach. In the case of Table E, the relation changes to y = 8(x – 4) + 1, or y = 8x – 31.
-
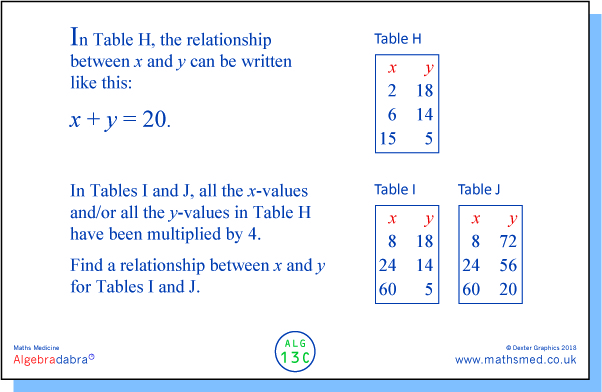
WEDNESDAY: Here we start with a new linear relationship that is perhaps easier to describe succinctly.... Again, we multiply the x- and/or the y-values by 4.
The relationship for Table J is easy to spot or derive, the one for Table I less so.
-
THURSDAY: We stick with Wednesday's relationship, and as we did earlier, we add 4 to the x- and/or the y-values. Finding the resulting relationships is not particularly challenging on this occasion but we include the task for completeness.
FRIDAY: We end the week with a task involving a much more challenging function. We provide four transformations for completeness, but, as suggested previously, it might be better to show the tables one at a time to prevent students feeling they have to rush from one to the next.
Note: In all of this week's task we have looked at relationships expressed symbolically and with tables of values. It is also worth drawing graphs of the relationships.

Sunday 29 April 2018

ALG 12

This week we look at Cartesian graphs of straight lines again. The aim is to focus on the visual aspects of the graphs, in particular the slopes of various lines, and to find points on the lines by using notions of proportion and similarity, rather than by immediately expressing the lines as equations (though that would, of course, be a perfectly legitimate thing to do).
In many of the tasks we have deliberately chosen points with very different sets of coordinates [such as (0, 0) and (100, 101) in ALG 12A] so as to encourage students to visualise or sketch what's going on, rather than attempt to use accurate drawings.
-
MONDAY: Many students should be able to find coordinates for some points on the red line, eg (50, 50.5) and (200, 202). Encourage students to seek out lots of points as some might provide insights that would help with parts i. and ii., eg (10, 10.1) and (1, 1.01).
It is likely that some students will suggest that the value of the y-coordinate in part i. is 102. How can we show (eg with the aid of a sketch) that a point with coordinates (101, 102) is not on the red line? How can we decide whether it is above or below?
-
TUESDAY: We search for some more widely-spaced points.
A sketch might help; a table of values might help, to record moves towards the y-axis, say, in well-chosen steps (eg 10 to the left, 1 up).
PS: Here's a nice solution, posted on Twitter. Quite condensed but worth unpicking!

-
WEDNESDAY: More points on a line, near and far...
Follow the light green straight line.... Not that different from the previous task, but no harm in consolidating earlier ideas. And you might like to think up further variations....
-
THURSDAY: Two lines, by way of a change.....
Here we take a somewhat different approach by offering two methods for students to interpret. The first is quite grounded, the second is more abstract. You might, of course, prefer to ask students to come up with their own methods first, though the task itself is quite demanding.
-
FRIDAY: By way of a further change, we home in on the microscopic - though you might want to zoom out again ....
Don't be put off by the fractions! The underlying algebraic relationships are not that difficult.... And there are also some nice geometric approaches that can be used to solve the task.
Commentary: A closer look at the coordinates reveals that for one of the line segments the coordinates add up to 1, for the other the y-coordinate is 3 times the x-coordinate. Which two numbers add up to 1, where one number is 3 times the other? We can get there fairly rapidly using trial and improvement. Or we could draw a 'bar' or 'rod' or number line (although this requires quite a difficult switch in thinking - the 'bar' is not a line segment in the Cartesian plane!):

We can also express the relations between the coordinates more formally, as the simultaneous equations x + y = 1 and y = 3x, leading to x + 3x = 1, so x = 1/4, y = 3/4.
-
Here's a nice approach (by Matt L) that is more geometric. It involves constructing a new point on the line through the steeper line segment that is vertically below the left hand end-point of the other line segment. It also uses the fact that this line segment slopes at 45˚, so the two segments labelled 'a' are equal.

We can extend the two given line segments still further, until they touch a unit square. [In fact, this is what I started with when I designed the task!]
A couple of years ago there was a flurry of tasks on Twitter involving dissected squares of this sort, usually with one region shaded, the aim being to find 'What fraction of the square is shaded?' My favoured approach was to draw equally spaced parallel lines to produce equal intercepts, as here:
One could then argue along these lines: the diagonal of the square has been cut into 4 equal segments, so starting at the bottom left corner, say, of the square, point P is 1/4 units across and 3/4 units up. [Or the height of the triangle seated on the base of the square is 3/4 so its area is 3/8 of the unit square.]
A related and perhaps more direct approach (whether to locate P or to find areas) is to make use of the fact that this triangle on the base of the square is similar to the small 'upside down' triangle above it, with a base that is 3 times as long.
I remember someone coming up with an algebraic solution to one of these area tasks on Twitter. This took me by surprise and I was impressed by the power of such an approach. But it also seemed disappointing to 'abandon' the geometry! Of course, one might say the reverse about the ALG 12E task. Here an algebraic approach would seem an obvious choice and it is perhaps a bit perverse to go to the lengths of constructing a geometric approach instead!